



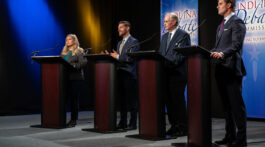


The Indiana Fiscal Policy Institute (IFPI) used its 2026 annual election luncheon to spotlight four key measurements that experts say will shape the state’s economic future: inflation’s unequal impact, educational attainment, household self-sufficiency, and population trends.
The event opened with acknowledgments of sponsors including Comcast, Eli Lilly and Company, Duke Energy, Indiana Bond Bank, CenterPoint Energy, and Indiana University Health. IFPI also announced new leadership moves: Chris Bath and Jacob Laskel were selected as new directors for 2027, while Ben Tooley and John Stafford joined the advisory committee, which provides peer review for IFPI’s research and publications.
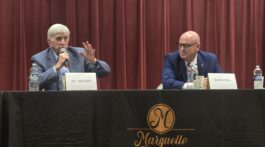
IFPI chair Mark Fisher, who also serves as CEO of the Indiana Association of Realtors, framed the panel’s purpose as a discussion about how measurement drives policy.
“They say you cannot manage what you do not measure, but different measurements and different metrics tell different stories,” Fisher told attendees as he introduced the four “Hoosier thought leaders” invited to present the indicators they see as most important to Indiana’s future.
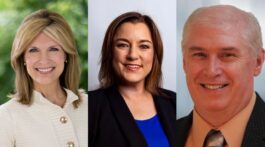
The panel featured:
- Dr. Kyle Anderson, clinical assistant professor of business economics at IU Kelley School of Business in Indianapolis;
- Dr. Sue Elsperman, recently retired president of Ivy Tech Community College and former Indiana lieutenant governor;
- Dagny (Peggy) Falk, PhD, director of research at the Center for Business and Economic Research at Ball State University; and
- Chris Johnston, former director of the Indiana Office of Management and Budget (2019–2024).
Each panelist had five minutes to make the case for a preferred indicator, followed by group discussion. The audience was scheduled to vote at the end on which measure they believed was most important.
Inflation and the “Premium Economy”
Anderson focused on inflation, using a 14 percent price increase for U.S. Open tennis tickets as a way to distinguish between high-end, demand-driven inflation and cost-of-living pressures on working families.
His key analytical tool was the Consumer Price Index for Urban Wage Earners and Clerical Workers (CPI-W), which he said better reflects inflation experienced by working households compared to the headline CPI.
He noted that:
- In the immediate post-COVID period (around 2022–2023), CPI-W ran higher than overall inflation, suggesting working families were hit harder.
- As inflation cooled in 2024 and 2025, CPI-W moderated more quickly, briefly improving affordability for those households.
- In 2026, however, rising energy and food prices appear to be reversing those gains.
Panelists tied Anderson’s presentation to concerns about a “K-shaped economy,” in which higher-income households can absorb premium price increases, while lower- and middle-income Hoosiers struggle with essentials.
Education and “Credentials of Value”
Falk turned to educational attainment as a long-term driver of growth and a proven tool to reduce poverty.
Citing national research, she said each additional year of schooling raises earnings by roughly 7–10 percent. Yet Indiana ranks low among states in the share of adults with a bachelor’s degree or higher—about 29.5 percent, placing it ninth from the bottom among 50 states plus D.C. and Puerto Rico.
However, Falk highlighted a more nuanced measure from the Lumina Foundation: “credentials of value,” which include short-term certificates, associate degrees, bachelor’s degrees and higher, as long as they lead to earnings at least 15 percent above the national median for high school graduates. On this broader measure, Indiana moves to the middle of the pack, ranked 22nd, suggesting the state performs better when non-degree pathways are included.
She also noted:
- Only about 52 percent of Indiana’s 2024 high school graduates enrolled directly in college, down from 66 percent in 2009.
- National estimates suggest an additional 10–12 percent go to trade schools, 2–4 percent into registered apprenticeships, and around 1 percent into the military, implying roughly 70 percent pursue some form of postsecondary training.
- Poverty rates fall sharply with education: from 23.6 percent for those without a high school diploma to 12.6 percent for high school graduates, and 4 percent for those with a bachelor’s degree or higher.
Elsperman praised Falk for looking beyond four-year degrees, arguing that the traditional bachelor’s “may have been the workhorse of the last 100 years” but may not dominate the next century as credentials and skills-based pathways expand.
Beyond Poverty: Self-Sufficiency
Elsperman’s own chosen metric was the self-sufficiency standard, developed in the 1990s at the University of Washington and adopted in Indiana to better capture what it actually takes for households—not just individuals—to meet basic needs without assistance.
She contrasted it with the Official Poverty Measure (OPM), which:
- Assumes food is one-third of household expenditures,
- Is based on an outdated family model and cost structure, and
- Does not reflect geographic cost differences or the varying costs of children (for example, infants in daycare versus school-age children).
The self-sufficiency standard instead looks at total household income against localized costs of housing, childcare, food, healthcare, transportation, taxes, clothing, and a modest emergency cushion.
According to Elsperman, while Indiana’s official poverty rate in 2020 was roughly 11 percent, the share of households that are not self-sufficient—that is, whose incomes do not cover realistic basic expenses—is closer to 27 percent. She said this measure exposes a larger share of Hoosier families who are “above poverty on paper but not truly able to make ends meet.”
A county-level map of self-sufficiency showed especially high levels of economic strain in several regions of the state, underscoring regional disparities in affordability and opportunity.
Panelists said the measure has appeal across ideological lines: it points to the need to raise incomes through education and workforce development, while also highlighting policy levers on the expense side, such as childcare costs and housing affordability.
Population as a Verdict on Quality of Life
Johnston, drawing on his experience at the Office of Management and Budget and in state performance management initiatives begun under former Governor Mitch Daniels, argued that population trends are a powerful macro indicator of how well a state is performing.
He framed state government programs—from education and economic development to health, infrastructure, and public safety—as tools to improve quality of life. The question, he suggested, is whether people are “voting with their feet” in response.
Using data from 2021–2025 and comparing Indiana to Illinois, Kentucky, Michigan, and Ohio, Johnston highlighted:
- Indiana is the only state in the group that recorded positive population growth in each of the last five years.
- On a percentage basis, Indiana led annually, with growth ranging from 0.4 percent to 0.8 percent.
- Over that five-year span, Indiana gained about 180,000 residents—roughly half of the total gain across the comparison group—while Illinois lost nearly 80,000.
- Indiana showed gains in all three components of population change: domestic migration, international migration, and natural increase (births minus deaths).
He cautioned, however, that international migration, a major driver of gains for all states in recent years, has already begun to moderate sharply and may fall further amid changing federal policy and enforcement. At the same time, an aging population and lower fertility are slowing natural growth.
That leaves domestic migration—Americans choosing to move to Indiana from other states—as the most telling signal of how people perceive the state’s opportunities and quality of life.
Johnston also warned about the shifting age structure. Indiana’s “prime working-age” population (25–44) has only recently returned to its 2000 level, while the number of residents age 65 and over has grown much faster. He described 20 years of data as forming an almost perfect “X,” where growth in the senior population has overtaken growth in the working-age group.
These demographic shifts, he said, will have implications for the labor force, public finances, and the sustainability of services in both urban and rural communities.
Integrated Challenges
Fisher closed the discussion by noting how intertwined the indicators are: inflation and affordability, education and workforce quality, self-sufficiency and household stability, and population growth as a composite verdict on policy.
The audience was expected to vote on which measure they viewed as most important going forward, underscoring IFPI’s broader theme that the way Indiana chooses to measure its progress will profoundly shape its policy choices in the years ahead.